What the new Conteo Publisher can do
The new Conteo Publisher is here with a new design and layout, detailed statistics with timeline and marketing value as well as benchmarks of your performance against other providers.
We are happy to introduce the new Conteo Publisher. This offers you a variety of improvements:
- NNew design and layout for even more efficient work
- Better clarity thanks to the new navigation
- Detailed statistics with timeline and marketing value
- Benchmarks of your performance against other providers
Don't worry: all the functions you know and love will continue to work in the same way. We wish you lots of fun.
The dashboard - an overview
 |
To ensure a better overview, the new Publisher is divided into different sections instead of presenting all the information on one page. These sections are accessible via an intuitive navigation on the left-hand side: |
- Home: The start page provides you with an overview of all important information.
- Provider profile: Here you can manage your provider profile.
- Posts & Events: Here you can create content and view published content.
- Analytics & Leads: This section gives you access to detailed statistics, leads, benchmarks of your performance against other providers and an overview of your followers.
- Upgrades: Here you will find information on bookable package upgrades or individual services.
Home

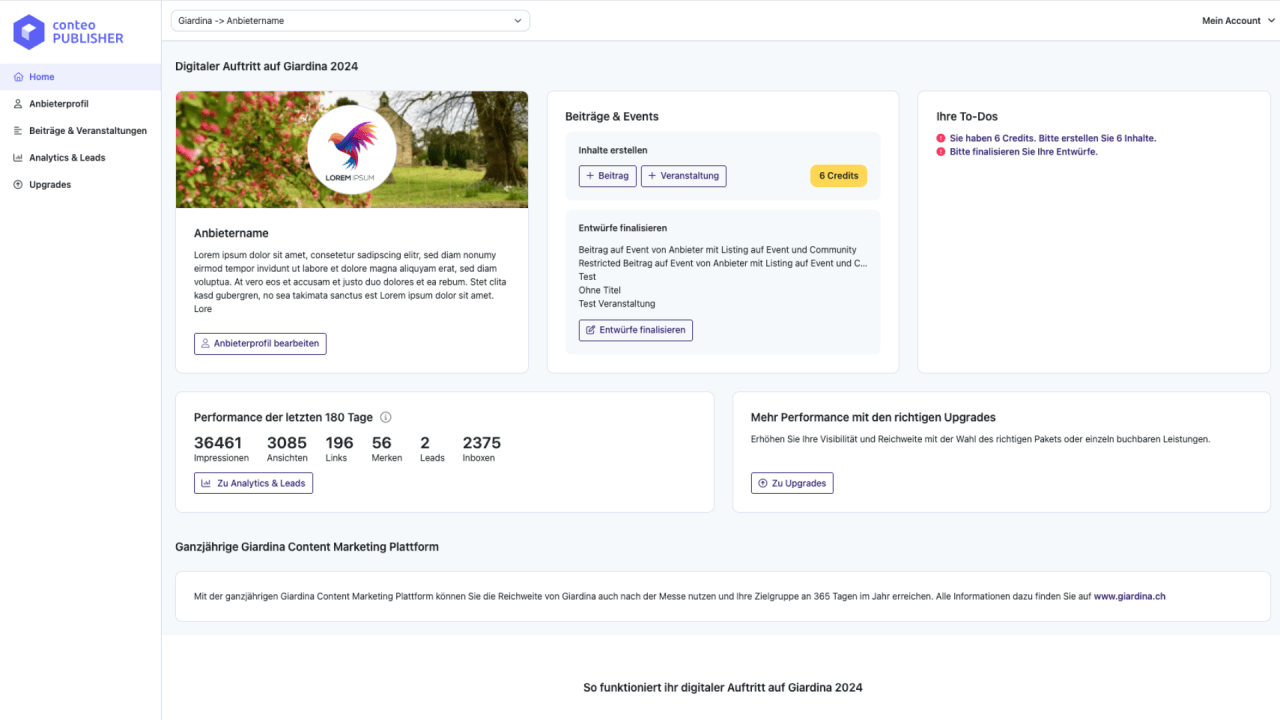
Depending on the time in the trade fair cycle, you will find all the important information for your digital trade fair appearance or your presence on the year-round content marketing platform at a glance on the start page:
- The preview of your exhibitor profile as it is displayed to users on the platform
- The number of open credits to create content pieces, your open drafts and the ability to create new content.
- All open to-dos to get the most out of your digital presence. Have you completed all the to-dos? Congratulations. You can now see the various options offered by the platform.
- An overview of the performance you have achieved with all content and your profile over the last 180 days.
If you manage several profiles, you can switch between them using the dropdown at the top of the screen.
Analytics & Leads: Statistics, Marketing Value, Leads, Benchmarks and Followers

Here you will now find a detailed overview of the value you have achieved with your digital presence at a trade fair, the associated content marketing platform or overall.
Statistics and Marketing Value
On this page, you will find all the statistics that your content and profile have generated. You can use the drop-down menu to choose whether you want to display statistics for a specific trade fair, the content marketing platform or "All" statistics. You can also set the time period for which the statistics were recorded.
For the filters set you will see:
Performance and Marketing Value: The sum of the statistics of all content, as well as the profile and its marketing value.
The marketing value quantifies the hypothetical amount that you would have to spend on other marketing channels, e.g. LinkedIn or Google Ads, to reach the same target group with the same impact. The following benchmark values are used for this:
- Impression: 0.05 CHF/EUR
- Insight: 1 CHF/EUR
- Link: 2 CHF/EUR
- Bookmarks: 2 CHF/EUR
- Lead: 5 CHF/EUR
- Inbox: 0.05 CHF/EUR
Statistic Plotter: A graph that allows you to visualize individual statistics over the selected time period. The impact of a trade fair can be seen very clearly in the graph. The effect of personalized updates by e-mail is also clearly visible as individual spikes in the statistics. The personalized updates by e-mail are tracked with the new "Inboxes" statistic, which has been collected since 16.07.2024.
Performance and Marketing Value detail view: A table that contains all content and your profile including the respective statistics for the set filters. The profile is always included, regardless of the filters set, as it does not differentiate between a trade fair or the content marketing platform.
Tips for using the statistics:
The detailed statistics can be used to answer the following questions, for example:
- How much total value did I generate with my digital presence at a trade fair? Select the relevant trade fair from the drop-down menu. The default period is set to "All" so that the entire trade fair presence is displayed.
- What value have I achieved with my digital presence on the content marketing platform since the last trade fair? To do this, select the value "Content marketing platform" in the drop-down menu and set the time period to the time since the last trade fair.
- What total value have I generated with my digital presence on the platform? To do this, select the "All" option in the drop-down menu and also set the time period to "All".
Leads
Here you will find all the leads that you have generated on the platform. Similar to the statistics, you can use the dropdown to view leads from a specific trade fair, the "Content marketing platform" or "All" leads and set the time period over which the leads were generated. You can use the export button to export the leads that are displayed in the table.
Benchmarks

Here you can see how your digital presence at a trade fair compares to other exhibitors. You can choose between different trade fairs via a drop-down menu.
For the selected trade fair, the statistics of all content that you have published for it, as well as your provider profile, are compared with:
- Average: What was the performance of the average exhibitor?
- Average top 5%: What is the average of the top 5% of exhibitors for each statistic?
The Marketing Value summarizes the comparison with other providers concisely. It is ideal for answering the crucial question: "How well do I compare to the competition?"
Followers

Here you will find an overview of your current number of followers as well as all publicly accessible profiles of your followers. The profiles are linked directly to the corresponding community profiles on the website.
Posts & Events
Here you can create content and view content that has already been published or submitted
Create content

With the platform switcher, you can decide whether you want to create content for a trade fair or for the content marketing platform, provided you have a digital presence on both.
You can create new content using the corresponding buttons. The "Finalize drafts" table shows all open drafts.
Tip: Is one of the drafts in the table marked with a premium sign? Premium content types are displayed more prominently and cannot be created with normal credits. You have received a draft of a premium content type. Finalize it and benefit from the additional reach.
Your content:

Here you can see all published and submitted content. Using the dropdown, you can choose whether you want to see "All" content or only content that you have published for a specific trade fair or the content marketing platform.